The Floras of North America project
(Now part of the Cybercommons)
Michael Palmer, Department of Botany, Oklahoma State University
(not to be confused with the Flora of North America project)
| Jump to: | Goals | Floristic data | Limitations of Floristic data | Preliminary results | Exotic species | Plea for floras |
| Botanists
and Ecologists in North America have a rich tradition of writing Floras,
or lists of vascular plants. The potential of using these floras as
baselines for understanding patterns of, and threats to, modern
biodiversity cannot be overstated. Nevertheless, floristic work is
often published in obscure sources and is very difficult for biodiversity
stakeholders to obtain. Although information technology and data
transfer amongst scientists are both growing by leaps and bounds, floras
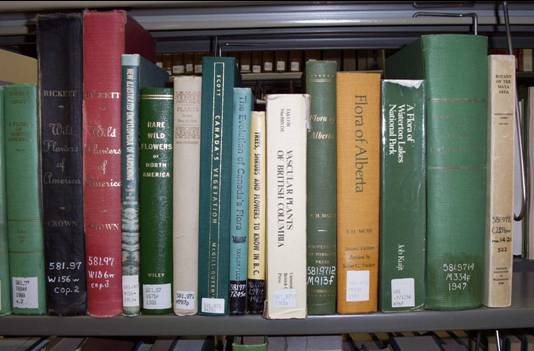
are largely confined to dusty shelves.
Imagine how biodiversity research could be facilitated if there was a georeferenced, easily accessible database that allows scientists to access raw floristic data from thousands of locations at many orders of magnitude of spatial scale and over time spans of decades. Although this might not be considered a high-tech 'sensor', it would allow us to ask basic macroecological questions as well as vital applied concerns. If integrated with current biotic inventories, it could be a part of a continent-wide 'biodiversity observatory'. |
|
| Collaborators: Michael Denslow (Appalachian State University) Leticia Dadalt (OSU Botany)
Peter Earls (OSU Botany) Hong Qian (Illinois State Museum)
Channing Richardson (OSU Botany) |
|
|
|
Acknowledgments Akbar Syed, Alan Weakley, Bill Lehman, Bruce Connery, Bruce Hoagland, Bruce Sorrie, Carolyn Klink, Catherine Hovanic, Daniel McGlinn, David Maxwell, Donna Ford-Werntz, Garrett Crow, Gary Wade, Glen Rink, Hong Qian, Jason Fridley, Jim Hull, John Hayden, Karen Ray, Kathryn Mauz, Kelly Allred, Kiyoshi Sasaki, Kristin Kegler, Kyanna Cherry, Lorna Lawrence, Louis Iverson, Mac Alford, Mark Withers, Martin Zocher, Michael Denslow, Michael MacRoberts, Neil Snow, Peter, Nick Rasmussen, P.K. Work, Paul Neal, Paula Shryock, Peter Earls, Peter White, Richard Mitchell, Ronald Hartman, Ronald Tyrl, Sandra Peterson, Sandrine Casanova, Sariah Tolsma, Sophonia Roe, Stephanie Glenn, Steve McLaughlin, Steven Hill, Steven Hull, Tatsuro Yamada, Will Lowry and numerous botanists.
U.S. Forest Service, Oklahoma Water Resources Center, Oklahoma EPSCoR, LIBRA, LUHNA project, OSU Interlibrary Services, Botanical Research Institute of Texas, Houston Advanced Research Center, National Biological Information Infrastructure |
|
1)
Assemble a
bibliography of floristic work. This bibliography will be of great value to
botanists beginning new work, and will eventually be able to be queried
geographically. For example, one could ask:
|
3)
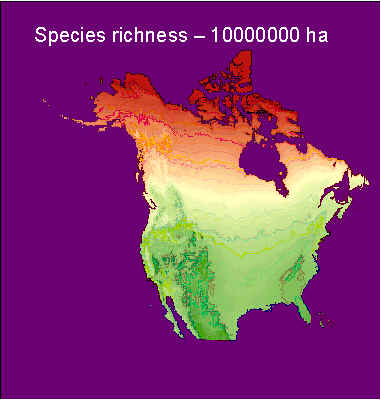
Develop predictive models for species richness. We can use our data set to develop regression models to predict how many
species
‘should‘ occur in a given region. Using
such models as a standard, we can evaluate whether a region of interest is
particularly rich or poor in species. This
can be used to prioritize areas for conservation, or to identify areas that
may have been inadequately explored. We also plan to use such predictive models to map patterns of the
diversity of vascular plants in North
America.
|
|
2)
Address basic questions in macroecology. A number of interesting questions have
frequented the pages of ecology and biogeography journals recently, that can
be readily tested using our data set. For
example:
|
4) Understand patterns of exotic invasion. Exotic species are not randomly distributed throughout the continent. We plan to use our data set to map patterns of exotic diversity, and to determine the degree to which it is correlated with native diversity. We also plan to assess other correlates of exotic diversity, including those related to human impact. We can also use our predictive models to identify regions that are relatively pristine with respect to exotic invaders. |
|
|
An earlier version of this project is published in
Withers, M. A., M. W. Palmer, G. L. Wade, P. S. White, and P. R. Neal.
1998. Changing patterns in the number of species in North American floras. Pages
23-32 in T. D. Sisk, editor. Perspectives on the Land-Use History of North
America:
A Context for Understanding our Changing Environment. USGS, Biological Resources Division,
BSR/BDR-1998-0003.
Available online.
The project is also mentioned in: Denslow MW, Palmer MW, Murrell ZE. 2010. Patterns of native and exotic vascular plant richness along an elevational gradient from sea level to the summit of the Appalachian Mountains, USA. Journal of the Torrey Botanical Society 137: 67-80. Denslow MW, Palmer MW, Murrell ZE. 2010. A bibliography of North Carolina local floras. Castanea 75: 475-483. Fridley, J. D., H. Qian, P. S. White, and M. W. Palmer. 2006. Plant species invasions along the latitudinal gradient in the United States: comment. Ecology 87:3209-3213. Palmer, M. W. 1995. How should one count species? Natural Areas Journal 15:124-135. Palmer, M. W. 2005. Temporal trends of exotic species richness in North American floras: an overview. Écoscience 12:386-390. Palmer, M. W. 2006. Scale dependence of native and alien species richness in North American floras. Preslia 78:427-436. Palmer MW. 2007. Vascular Plant Checklists from Oklahoma. Oklahoma Native Plant Record 7: 67-77. Palmer, M. W. 2007. Species-area curves and the geometry of nature. Pages 15-31 in D. Storch, P. A. Marquet, and J. H. Brown, editors. Scaling Biodiversity. Cambridge University Press, Cambridge. Palmer, M. W., G. L. Wade, and P. R. Neal. 1995. Standards for the writing of floras. BioScience 45:339-345. Qian H, Fridley JD, Palmer MW. 2007. The latitudinal gradient of species-area relationships for vascular plants of North America. American Naturalist 170: 690-701. |
|
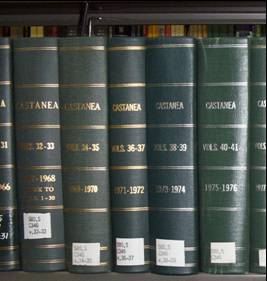
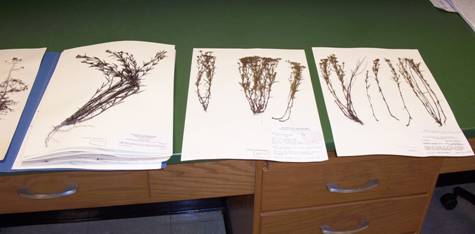
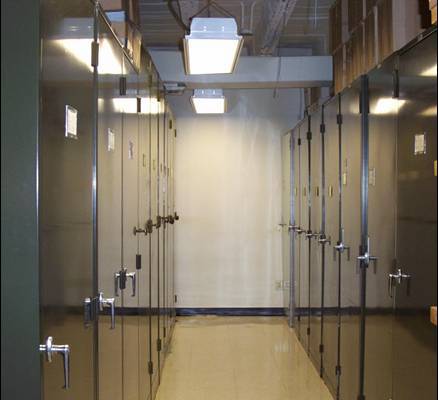
The raw data for floristic research consist of "voucher" plant specimens stored in herbaria. |
|
 |
|
| There are numerous ways such floristic data have been compiled for the analysis of biodiversity. The most commonly used methods in ecological and biogeographic research are range maps, dot maps, and vascular floras. | |
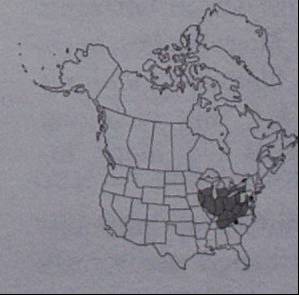
| Range maps consist of an outline of the presumed range of species, and are usually hand-drawn (either based on experience or specimens). Such maps are the most widely used kind of data for assessing broad-scale biodiversity patterns. Unfortunately, they suffer from a number of problems. For example, they do not adequately demonstrate 'gaps' in species distribution within a species' range. |
|
|
|
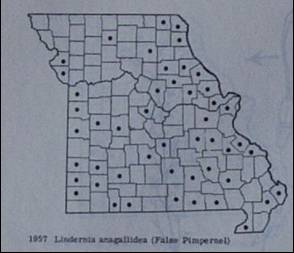
Dot maps have long been used for assessing species ranges, but only recently have they been used extensively for evaluating biodiversity. County dot maps, in which the occurrence of a plant specimen of a given species is indicated by a dot, is the most common type of dot map used in North America. The major limitation of dot maps is the asymmetry of errors (a false absence is far more likely than a false presence). A second problem is that the effort of botanical exploration is rarely consistent throughout a region (such as a state), thus leading to false gradients in biodiversity. |
|
'Vascular flora' is defined
in many ways.
We adopt the following:
“A list of the vascular plant species documented to
occur in a defined area, which is intended to be
representative
of the area”
|
|
|
|
Floras are found in:
|
|
We located floras by:
|
 |
|
Some things that appear to be ‘floras’ by their titles do not meet our criteria. Such floras include:
|
|
Data gathered from each flora
include:
|
|
Length of species list = f(species richness, behavior of botanists)
In particular, some areas are better studied than others - and hence have a higher number of recorded species. This observation is not new:
“It is, I find, in zoology as it is in botany: all nature is so full, that that district produces the greatest variety which is the most examined” - Gilbert White, Natural History of Shelbourne, 1768
| Problems with synonymy: names
change, species
are split or lumped, transferred to other
genera or families, demoted to subspecific status, etc.
Changing names will not affect the total number of species, but the other issues are potentially problematic. However, we argue that issues of synonymy have relatively little impact on our results. |
|
|
|
This research has just begun,
and (pending funding) future plans include:
|
|
We only have seen about half of the floras in our bibliography; many of the remainder are difficult to obtain by standard means. Furthermore, we suspect that there are hundreds of existing floras that we are not yet aware of.
If you have access to obscure floras, I would really like to hear from you.
I am eager to receive reprints, photocopies, electronic versions, or
loans of floras. I am also eager
to learn of the existence of floras new to the database, even without access
to the source. I can supply you
with a list of the works I know about in your state or province – as well
as a list of the ones I do not yet have.
We do have a broad definition of a flora, but we also exclude many things
that appear to be floras. For
example, I am usually not interested in spring floras, woody plant floras,
trail guides, cumulative lists of species encountered in study plots,
computer printouts of herbarium holdings, etc.
I do try to keep track of some of these 'nonfloras' in my bibliography, but I do
not need access to the originals.
Unfortunately, we do not have financial resources to reimburse for copying
and shipping. However, I hope
our bibliography of floristic works in your state or province (though
currently in need of editing) offered in exchange would be of some value to
you.
Contact me at mike.palmer@okstate.edu. |
|